Code coverage is a great metric that measures the degree of which the source code of the program has been tested. In other words, how safe your program is.
We’ll start with basic terms/criteria of code coverage (from Atlassian):
- Function coverage:how many of the functions defined in the source code have been called.
- Statement coverage: how many of the statements in the program have been executed.
- Branches coverage: how many of the branches of the control structures (if/elsestatements, cases, etc) have been executed.
- Condition coverage:how many of the Boolean sub-expressions have been tested for a true and a false value.
- Line coverage: how many of lines of source code have been tested.
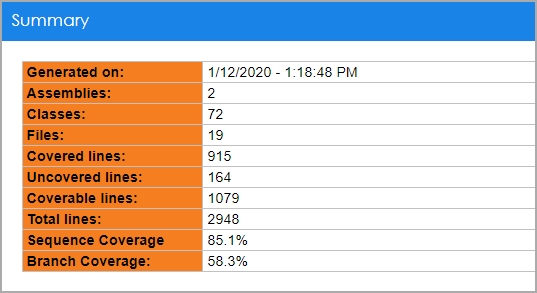
Code coverage report usually present a summary of all of these criteria combined. We can clearly see how many lines of code are covered out of a total number of cover-able lines (line coverage), which the Sequence coverage sums it up in percentage (estimates to 85% in this case).

This data helps you to identify sections of code not covered and sections of code partially covered by your tests, as well as sections of code where you have complete coverage. With this information, you can add to or change your test suites to maximize their effectiveness and make your application safer.
Safer means less bugs, faster development. If your company considers itself Agile, it is highly recommended to use a code coverage tool as a part of Continuous integration (which goes hand by hand with Agile).
However, there’s something interesting happening here. The Sequence coverage shows 85% while the Branch coverage is only at 58%. Why is this happening?
The reason is, the tests we wrote covered most of the lines of code inside the methods, but didn’t really go into every branch in it. Imagine a pretty large method, say with 30 lines. There’s an if statement and it’s short inside of it – just 2 lines.
However, most of the remaining lines are in the else statement– 20 of them. In the Unit test we wrote we only checked the else statement because the arguments of the method didn’t match the “if” one. Due to that we’ll probably have a high sequence coverage but only about 50% branch coverage.
Let’s see an example (C#), given this simple method:

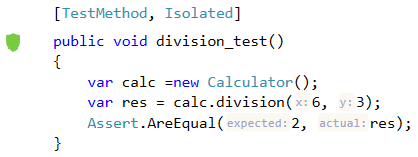
Now, consider the following unit test:

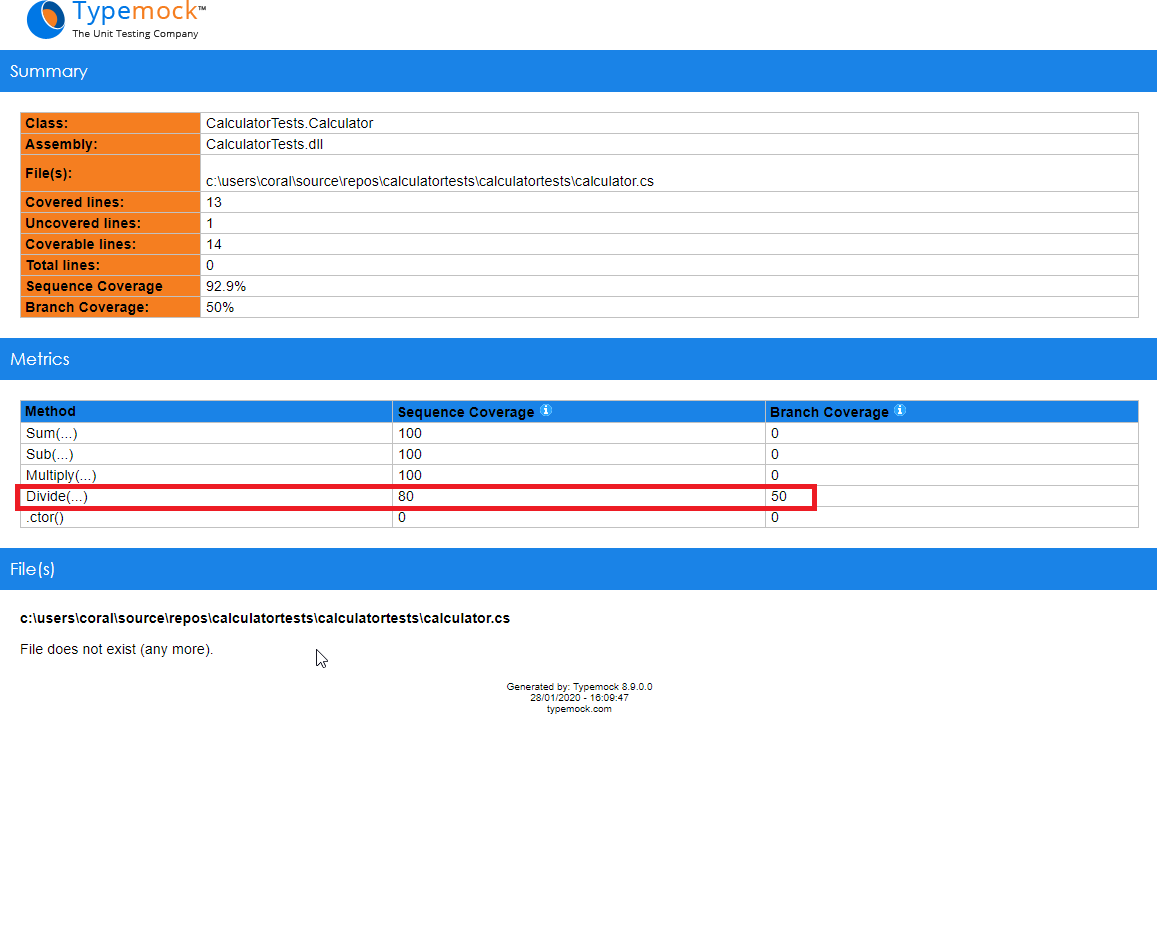
The coverage report (taken from Isolator .NET coverage feature on the build server) would be as below:
The unit test covers only one branch of the method “division,” namely the one with y different than 0. Therefore, Branch Coverage is only 50%.
The Sequence Coverage shows 80% since there are 5 lines of code under the method statement out of which 4 are covered by the test.
Then, how do you get the most out of your coverage report? There’s no magic button to press on in order to do that. It’s all about the right analysis. Line coverage and Branch coverage have to be balanced, as close as possible to each other or otherwise our tests might be useless. We might as well write them only to increase the percentage of coverage visually just to feel good with ourselves. That’s not the purpose 😊
Remember: having 100% code coverage doesn’t mean everything is perfect and tested completely. It indicates that every line of code is tested, but it doesn’t necessarily mean that they are tested under every situation.
Even after following coding standards and methodologies, humans make mistakes, leading to errors and defects in a product. Thorough testing is what makes a product high quality. Unit testing is a good start, but it is sometimes skewed and is difficult to measure or improve.
Read more about Typemock for Build Server here.


